Asset Liability Management
Integrated ALCO reporting covers Net Interest Income (NII), Economic Value of Equity (EVE), Duration, and Earnings at Risk (EAR) with shock analysis. Perform interest gap analysis, calculate hedge ratios, examine balance sheets, and optimize hedging strategies.
Asset-Liability Management (ALM)
Sophisticated Balance Sheet Optimization, Interest Rate Risk Management, And Liquidity Planning
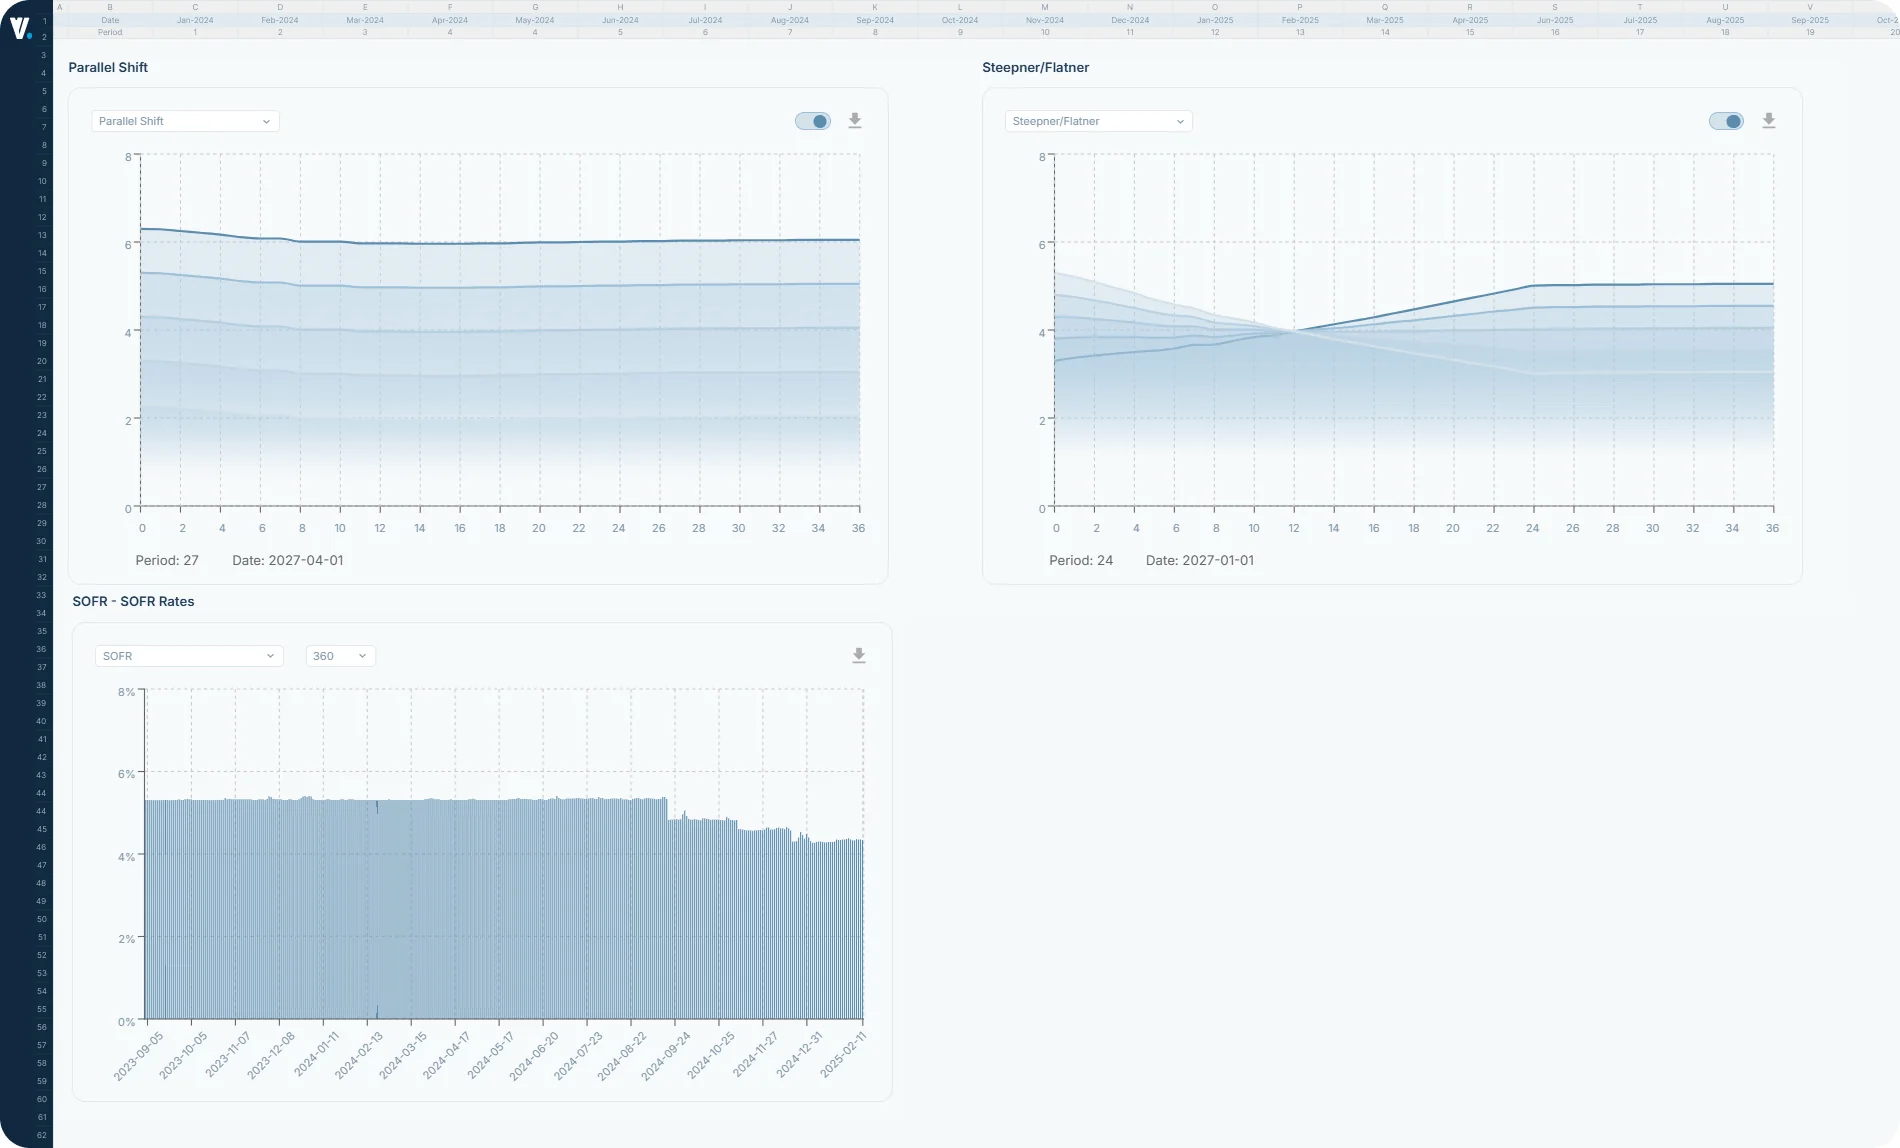
Comprehensive Rate Shock Testing
Model parallel and non-parallel rate scenarios
NII & EVE Measurement
Dual perspective on rate risk exposure
Dynamic Scenario Analysis
Instant recalculation across rate environments
Regulatory Reporting
Pre-formatted outputs for compliance
Master Interest Rate Risk Management
Quantify and manage your institution's exposure to interest rate movements with precision. Our comprehensive IRR framework measures both earnings sensitivity (NII) and economic value (EVE) impact, providing the insights needed for proactive risk management and regulatory compliance.
Proactive Risk Mitigation
Identify and hedge interest rate exposures before they impact earnings or capital, protecting your institution from adverse rate movements.
Regulatory Confidence
Meet FDIC, OCC, and Federal Reserve IRR requirements with comprehensive measurement, stress testing, and documentation.
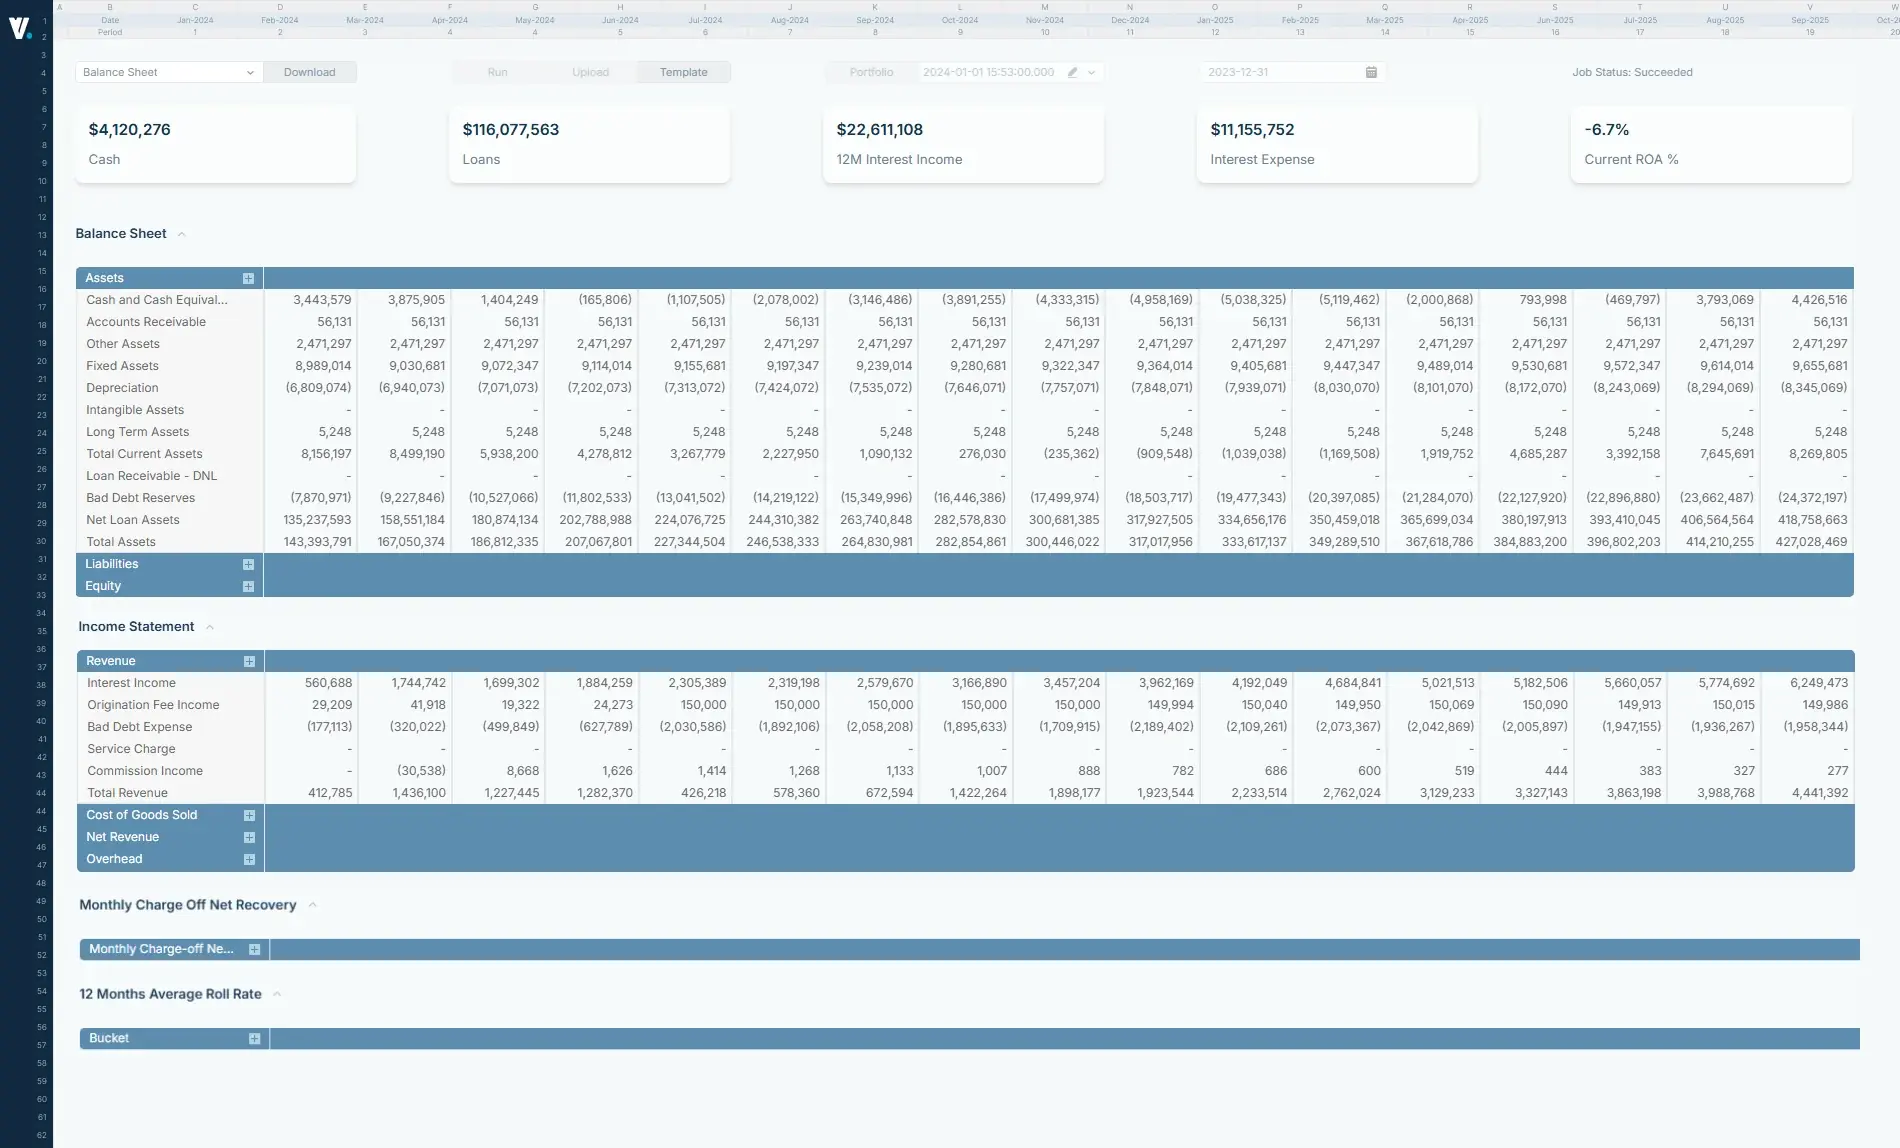
Strategic Balance Sheet Management
Optimize asset-liability mix to balance risk appetite with earnings targets, supporting informed growth and investment decisions.
Enhanced Board Reporting
Provide clear, intuitive visualizations of rate risk exposures and sensitivities that enable informed governance and oversight.
Reduce Earnings Volatility
Stabilize net interest income across rate cycles through better understanding of repricing characteristics and hedging opportunities.
Capital Protection
Safeguard economic value of equity from interest rate shocks, maintaining capital adequacy and supporting long-term financial strength.
Demo Video Overview
See the platform in action — a quick walkthrough of Vector CFO
Latest Resources
Stay Informed With Our Latest Research And Articles